| ID | X | Y |
|---|---|---|
| 1 | 0 | 9 |
| 2 | 0 | 2 |
| 3 | 1 | 3 |
15 In-class experiment
16.1 Introduction
16.1.1 Welcome
Today you will design and run a small experiment by hand.
You will learn about random assignment, analysis, and design evaluation — without a computer on your desk (for the physical part).
Work in teams. Be precise. Play fair.
16.1.2 Your materials
Each team receives an envelope with 20 cards.
16.1.3 Your materials
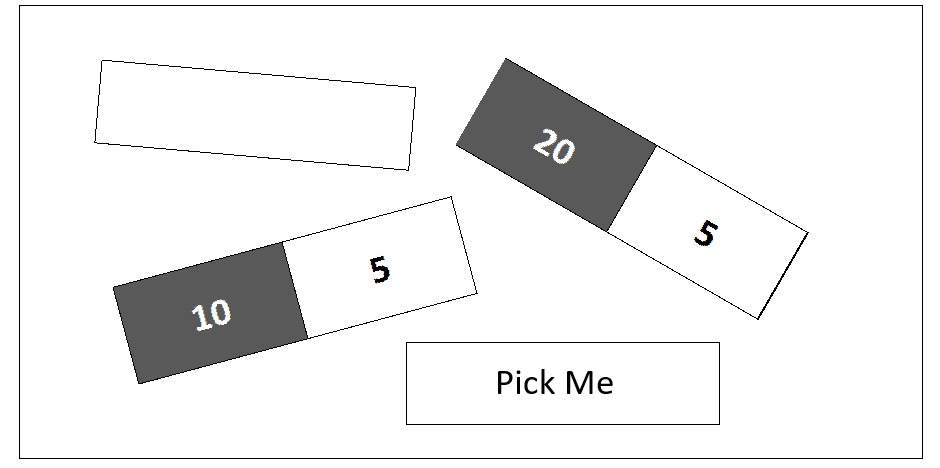
16.1.4 What’s on each card
On each card:
- One number in black writing on white background
- One number in white writing on black background
- On the reverse, there is an ID and there may or may not be a symbol or text
16.1.5 The research question
Question: On average, are the black numbers larger, smaller, or the same as the white numbers?
This is your “estimand” — the quantity you want to learn.
16.1.6 The catch (honor code)
When you turn over a card, you may read only one number:
- the black number, or
- the white number — not both
You must decide before reading the card which number you will record.
You may look at the symbol on the back before choosing.
16.1.7 Why this is hard
Each card can give two possible answers:
- the black number
- the white number
You never observe both on the same card.
You choose the assignment to white or black:
\(X=0\): read white or \(X=1\): read black.
16.2 Step 1
16.2.1 Step 1 — First experiment
- Place all cards face down.
- Choose your assignment strategy: for each card, will you read black or white? (Any method is allowed — but write it down.)
- Turn cards over and record the number you chose to read.
- Enter results in a spreadsheet (one row per card).
16.2.2 Data you record
| Column | Meaning |
|---|---|
| ID | Card identifier |
| \(X\) | Color read: white = 0, black = 1 |
| \(Y\) | Number you observed |
| (later) | Extra columns for symbols or notes |
16.2.3 Example data
First three rows of your spreadsheet:
16.2.4 Step 1 — First experiment
- Estimate of the average difference (black minus white)
- Tell us what you conclude about whether the black or white numbers are bigger
- Record how certain you are: Very certain, somewhat certain, very uncertain
- [Option: record \(p\)-values if you calculate these]
16.2.5 Step 1 — Summary: 3 tasks
- Assign black or white
- Data collection in spreadsheet: 20 rows
- Analysis
- Average of white and black
- Which is bigger?
- Certainty?
- [Optional: \(p\)-value]
16.3 Step 2
16.3.1 Step 2 — Redesign and repeat
You completed one round. Now run 10 more.
Before you start, write a short pre-analysis plan (your design):
- Will you change how you assign \(X\)?
- Will you change how you analyze the data?
16.3.2 Step 2 — Redesign and repeat
Then repeat Steps 1–5 ten times.
Plot histograms of your estimates across the 10 runs.
[Optional: plot estimates of standard errors, and \(p\)-values.]
16.3.3 Step 2 — Redesign and repeat
| ID | X_1 | Y_1 | X_2 | Y_2 | X_3 | Y_3 |
|---|---|---|---|---|---|---|
| 1 | 0 | 9 | 1 | 7 | ||
| 2 | 0 | 2 | 1 | 1 | ||
| 3 | 1 | 3 | 1 | 3 |
| trial | black_average | white_average | black_bigger | certain |
|---|---|---|---|---|
| 1 | 5 | 1 | 1 | 1 |
| 2 | 2 | 6 | 0 | 1 |
| 3 | 3 | 3 | 0 | 1 |
16.4 Step 3
16.4.1 Step 3 — Reveal and diagnose
Now turn all cards over and read both numbers on every card.
- Calculate the true average difference (black minus white).
- Using your 10 runs, assess:
- Bias — did estimates center on the truth?
- Power — how often did you reject “no difference” when there is one?
- Explore correlations (white vs black numbers; numbers vs symbols).
16.5 Deliverables
16.5.1 What to submit
E-mail a short team report with:
- Team members’ names
- Pre-analysis plan (one paragraph: assignment; one paragraph: analysis)
- Histograms from Step 2
- Diagnosis from Step 3
16.6 In-class discussion
16.6.1 Discussion 1 — Design choices
- What assignment rule did you use for \(X\)? Why?
- Did you use the symbol on the back when choosing? Should you?
- Could your rule create bias even if you analyze correctly?
16.6.2 Discussion 2 — What you learned from repeating
- How much did your estimate vary across the 10 runs?
- Did standard errors and \(p\)-values behave as you expected?
- What would you change in a second generation design?
16.6.3 Discussion 3 — Truth and diagnosis
- Were your designs unbiased? Powerful? Well calibrated?
- When would blocking or adjusting for symbols help?
- How is this card game like a real field experiment? What is different?
16.6.4 Discussion 4 — Big picture
- What is the difference between design (how you assign \(X\)) and analysis (how you estimate)?
- Why is a pre-analysis plan useful before repeating a study?
- What did this exercise teach you about randomization?
16.6.6 Results
Distribution of estimates, standard errors, and \(p\)-values across estimators.
